Extract Min/Max of the Solution
This page provides a custom Grasshopper cluster to extract and visualize the minimum and maximum values from a simulation result field (e.g. von Mises stress) on a mesh.
The cluster includes:
Automatic detection of min/max value and location
Offset label positioning using a configurable labelOffsetFactor
Leader lines to clearly associate labels with their corresponding points
How to Use
Download and unzip the file
Drag and drop the .ghcluster onto your Grasshopper canvas
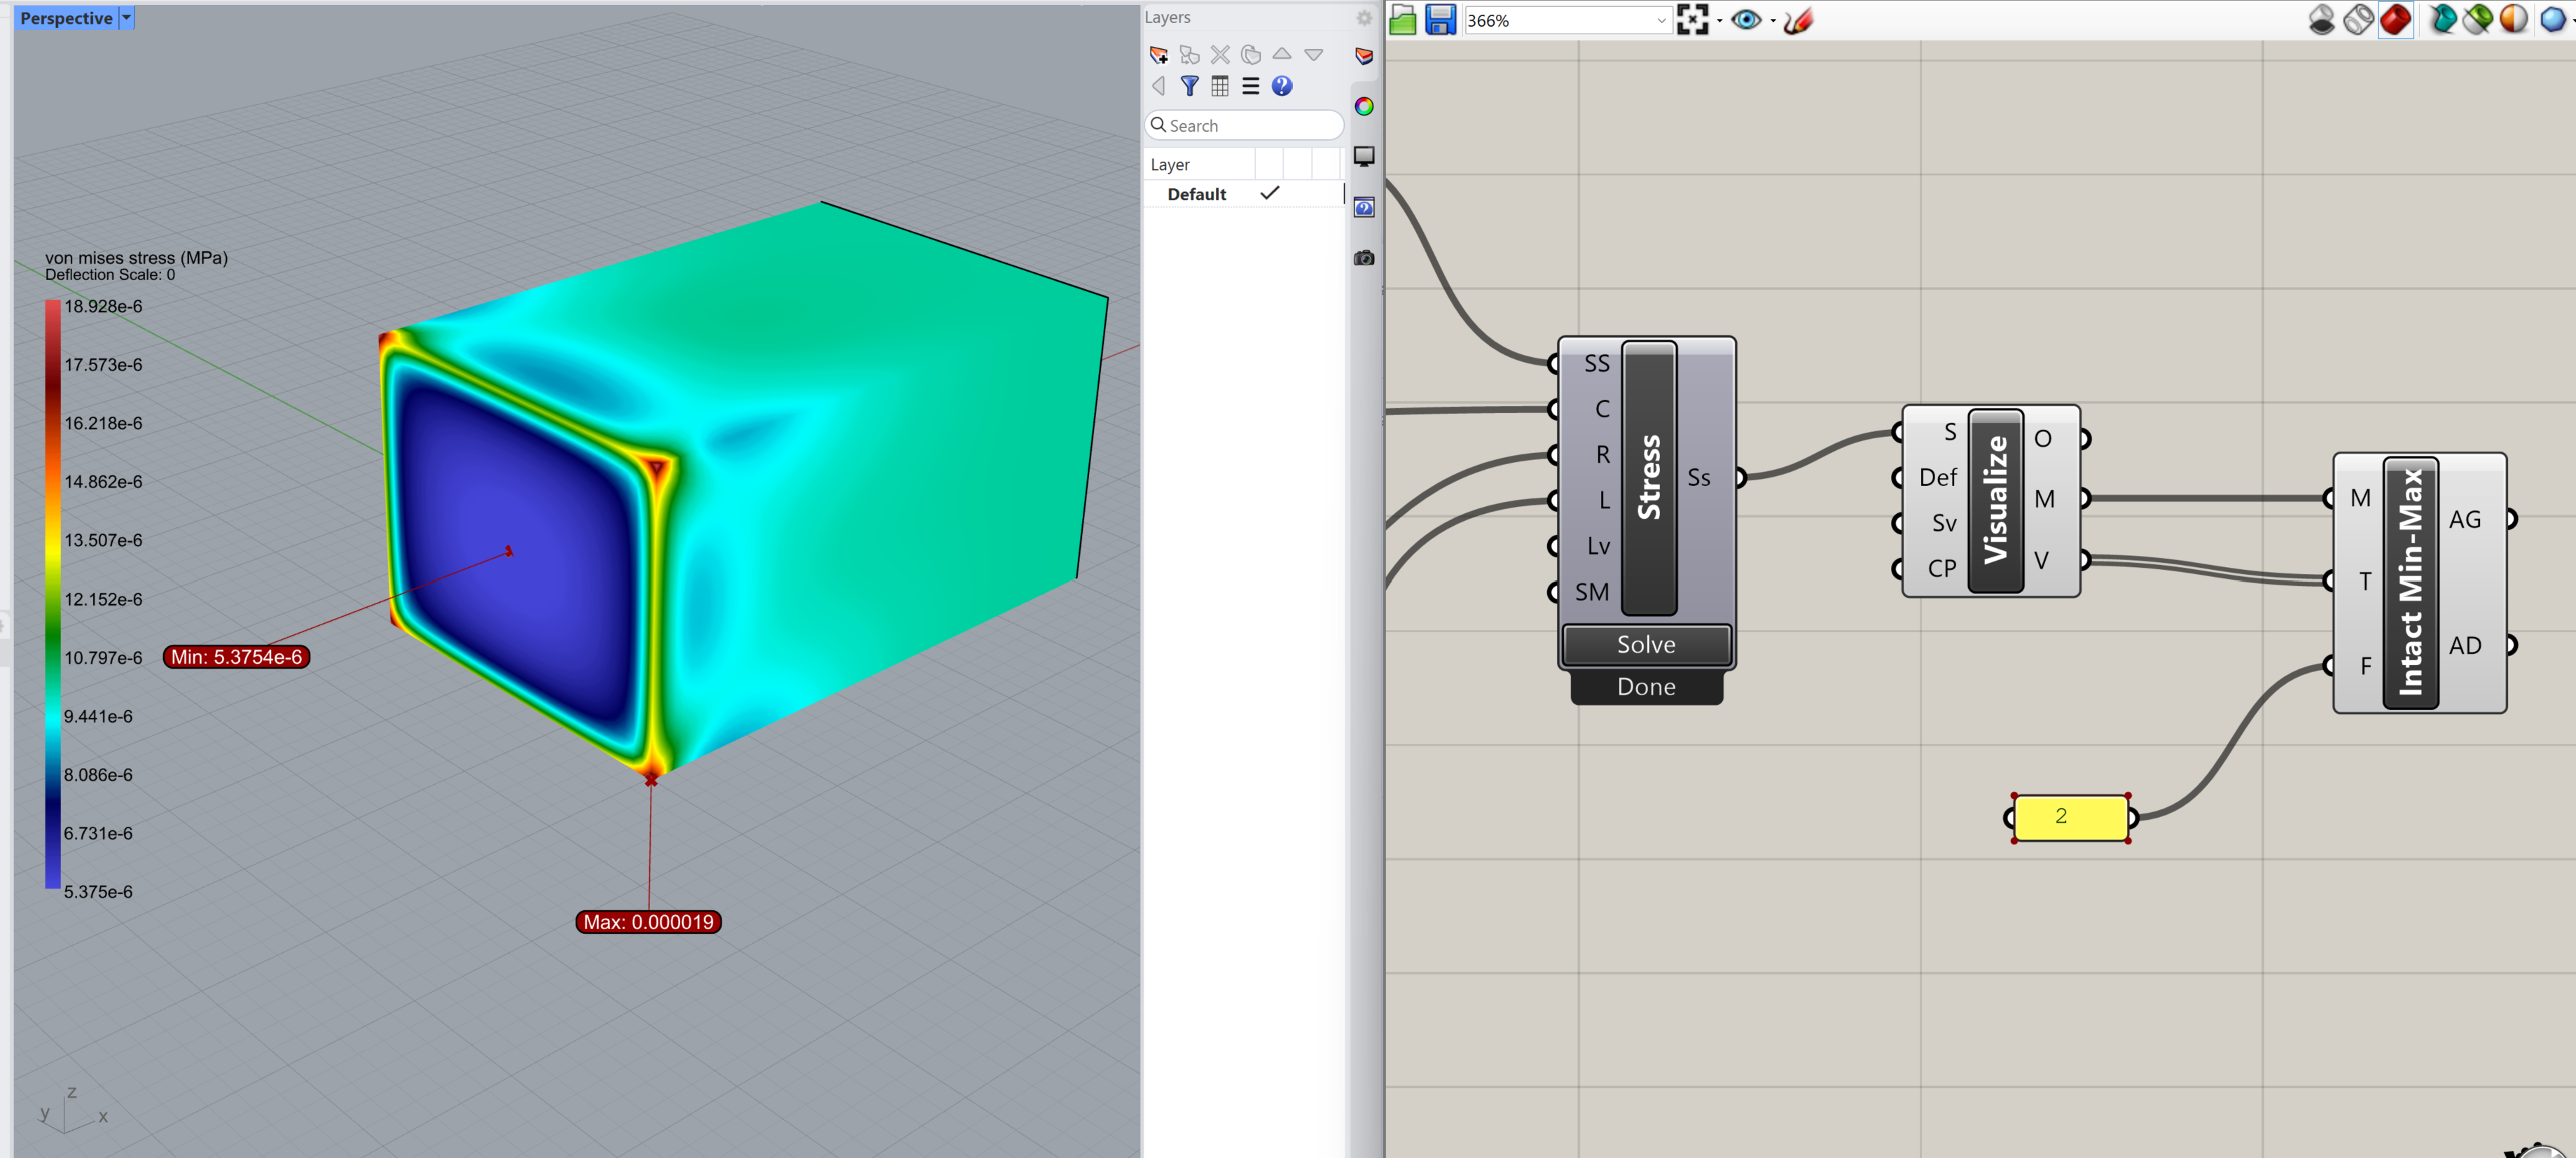
Connect it to your simulation results and the Visualize block, as shown below