Visualize Intact’s Solution Grid
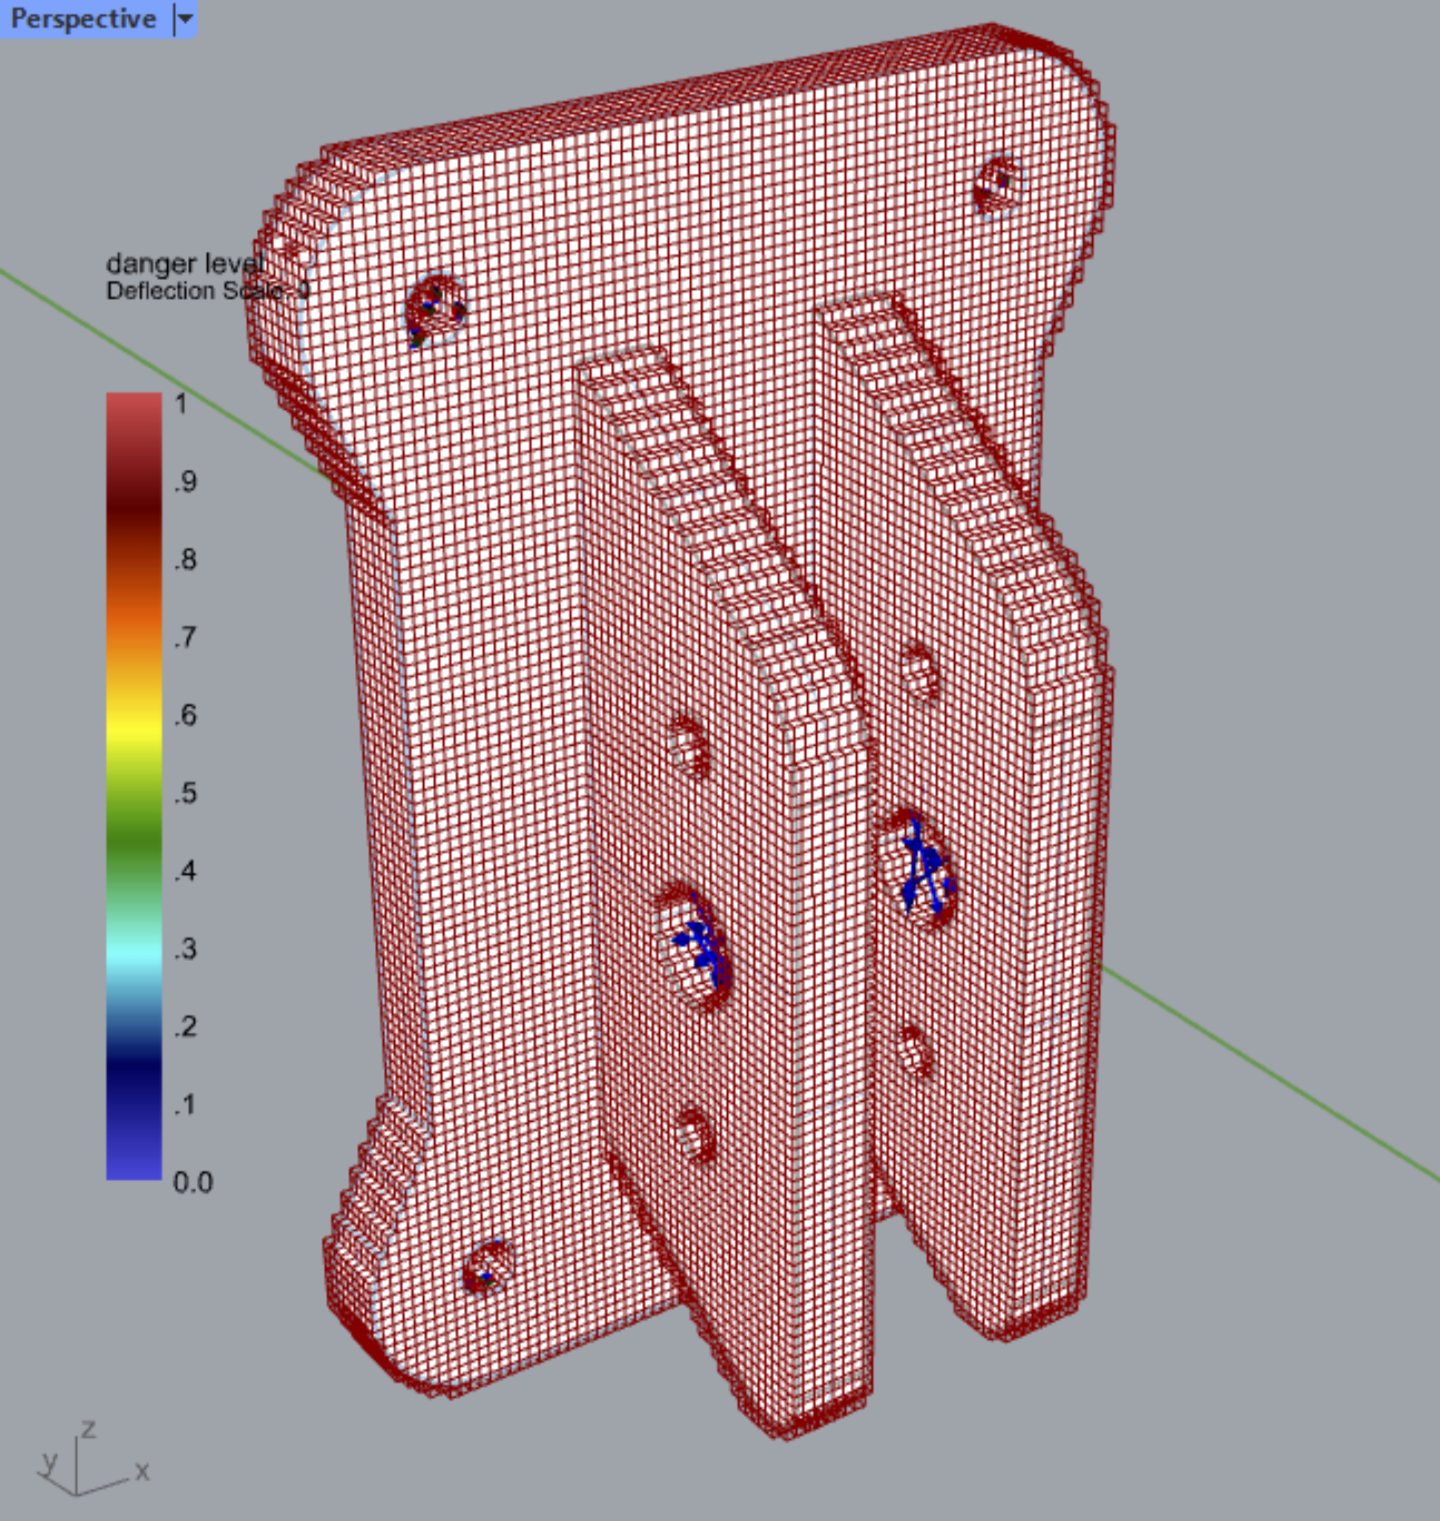
This page provides a custom Grasshopper cluster to visualize the immerse grid on which the FEA is conducted. You can use this to ensure sufficient degrees of freedom were allocated in the regions of interest in your geometry.
The cluster includes:
Visualize grid as wireframe or Rhino mesh
Get the geometry data for downstream application
How to Use
Download and unzip the file
Drag and drop the .ghcluster onto your Grasshopper canvas
Provide the Input: file path of the grasshopper_solutions.vtu file in the directory of the simulation you want to visualize. If you haven’t specified the simulation directory in the solver setting, by default simulation are created in C:\Users\{username}\AppData\Roaming\Intact.Simulation For Grasshopper\.
Optional Input: By default, the grid is created as a wireframe, but you can turn on the full mesh option.
Note
Note that the first load of the cluster might be slow as it installs some modules for Rhino’s Python.